

Based on Official Syllabus Topics of Actual Microsoft DP-500 Exam
Free DP-500 Dumps are Available for Instant Access
To prepare for the Microsoft DP-500 certification exam, candidates should have a solid understanding of data analytics concepts, as well as experience working with Microsoft Azure and Microsoft Power BI. They should also be familiar with data storage and processing technologies, such as Azure Data Factory, Azure Databricks, and Azure Stream Analytics.
The Microsoft DP-500 exam is conducted in a timed and proctored environment and consists of around 40-60 multiple-choice and scenario-based questions. The duration of the exam is roughly two hours, and candidates are required to achieve a minimum passing score of 700 out of a possible 1000. The cost of taking the DP-500 exam is $165, and the exam is available in multiple languages.
Microsoft DP-500 certification exam is designed for professionals who are interested in demonstrating their expertise in designing and implementing enterprise-scale analytics solutions using Microsoft Azure and Microsoft Power BI. Designing and Implementing Enterprise-Scale Analytics Solutions Using Microsoft Azure and Microsoft Power BI certification is ideal for individuals who are seeking to demonstrate their skills in data engineering, data analysis, and visualization using Microsoft technologies.
NEW QUESTION # 64
You have a Power Bl tenant
You invite an external consultant to work in the tenant.
You need to grant the consultant access to the tenant. The solution must meet the following requirements;
* The consultant must be able to consume, create, and update reports and datasets.
* The consultant must access content by using Azure AD B2B.
Which settings should you enable in the Power Bl Admin portal? Each correct answer presents part of the solution.
NOTE: Each correct selection is worth one point.
- A. External sharing
- B. Allow Azure Active Directory guest users to edit and manage content in the organization
- C. Allow Azure Active Directory guest users to access Power Bl
- D. Invite external users to your organization
Answer: B,C
NEW QUESTION # 65
You need to configure a source control solution for Azure Synapse Analytics. The solution must meet the following requirements:
* Code must always be merged to the main branch before being published, and the main branch must be used for publishing resource
* The workspace templates must be stored in the publish branch.
* A branch named dev123 will be created to support the development of a new feature.
What should you do? To answer, select the appropriate options in the answer area.
NOTE: Each correct selection is worth one point.
Answer:
Explanation:
Explanation
Box 1: main
Code must always be merged to the main branch before being published, and the main branch must be used for publishing resources.
Collaboration branch - Your Azure Repos collaboration branch that is used for publishing. By default, its master. Change this setting in case you want to publish resources from another branch. You can select existing branches or create new.
Each Git repository that's associated with a Synapse Studio has a collaboration branch. (main or master is the default collaboration branch).
Box 2: workspace_publish
A branch named dev123 will be created to support the development of a new feature.
The workspace templates must be stored in the publish branch.
Creating feature branches
Users can also create feature branches by clicking + New Branch in the branch dropdown.
By default, Synapse Studio generates the workspace templates and saves them into a branch called workspace_publish. To configure a custom publish branch, add a publish_config.json file to the root folder in the collaboration branch.
Reference: https://docs.microsoft.com/en-us/azure/synapse-analytics/cicd/source-control
NEW QUESTION # 66
You need to configure the Sales Analytics workspace to meet the ad hoc reporting requirements.
What should you do?
- A. Grant the sales managers the Build permission for the existing Power Bl datasets.
- B. Create a PBIT file and distribute the file to the sales managers.
- C. Grant the sales managers admin access to the existing Power Bl workspace.
- D. Create a deployment pipeline and grant the sales managers access to the pipeline.
Answer: B
Explanation:
Explanation
Allow sales managers to perform ad hoc sales reporting with minimal effort Power BI report templates contain the following information from the report from which they were generated:
Report pages, visuals, and other visual elements
The data model definition, including the schema, relationships, measures, and other model definition items All query definitions, such as queries, Query Parameters, and other query elements What is not included in templates is the report's data.
Report templates use the file extension .PBIT (compare to Power BI Desktop reports, which use the .PBIX extension).
Note: With Power BI Desktop, you can create compelling reports that share insights across your entire organization. With Power BI Desktop templates, you can streamline your work by creating a report template, based on an existing template, which you or other users in your organization can use as a starting point for a new report's layout, data model, and queries. Templates in Power BI Desktop help you jump-start and standardize report creation.
Reference: https://docs.microsoft.com/en-us/power-bi/create-reports/desktop-templates
Topic 3, Fabrikam, Inc.Fabrikam, Inc. is a software company that
develops educational software for higher education.
Fabrikam has the following business units:
* Finance and Accounting
* Sales and Marketing
* Operations
* Product
The Product business unit contains the following groups:
* User experience designers
* Software engineers
* Product managers
* Testers
The Operations business unit contains an information technology (IT) group. The IT group contains an enterprise analytics team and an information security team.
Fabrikam has three Azure Synapse Analytics workspaces named workspace! prod, workspace 1 test, and workspaceldev. Each workspace is connected to an Azure Data Lake Storage account and contains a lake database that is accessed by using the built-in serverless SQL pool. The data in the Data Lake Storage accounts is available in the lake databases for analysts from every business unit to query and analyze by using Power Bl.
The company imports the following files into the Data Lake Storage accounts:
* User experience data stored as JSON files
* Finance data stored as CSV files
* Sales data stored as CSV files
Fabrikam has a Power Bl tenant that contains 30 workspaces in Pro license mode. The data in the workspaces is a mix of Import and DirectQuery datasets. All reports are interactive.
Fabrikam has three frequently used workspaces as shown in the following table.
The Corporate Data Models workspace contains a dataset named Financial Model that is used by reports in the P&L workspace. Financial Model is maintained by the enterprise analytics team. The Corporate Data Models workspace and the User Experience workspace have corresponding development and test workspaces.
Administrators report an increase in the maintenance of Power Bl tenant assets due to analysts in the Finance and Accounting business unit who create new Power Bl datasets when the existing datasets already meet their needs.
Analysts in the Product business unit report the following issues:
* Datasets are published to the User Experience workspace, while the data sources reference workspace! test.
* The parsing of user experience data in Power Query is very slow.
The enterprise analytics team identifies two DAX measures in the Financial Model dataset that are consistently slow to execute. The team must identify all the reports that use the Financial Model dataset and notify the report owners of changes to the measures.
Members of the enterprise analytics team report that creating Power Bl reports and adjusting tables and views in Azure Synapse is tedious because they must switch between the Power Bl workspaces and the Azure Synapse workspaces.
The information security team identifies that the user experience data is being shared externally.
Fabrikam plans to implement the following changes:
* Power Bl will be registered as a data source in Microsoft Purview.
* The analysts in the Product business unit will create a more automated process for deploying Power Bl reports and datasets to the User Experience workspace.
The enterprise analytics team plans to perform the following tasks:
* Update the DAX calculations in the Financial Model dataset.
* Create views in the Azure Synapse workspaces to speed up the parsing of user experience data.
* Create and document the change management process for shared Power Bl datasets.
From Microsoft Purview, analysts in all the business units must be able to see all the assets in the Power Bl tenant and the Azure Synapse workspaces. Power Bl asset information must include lineage to identify the data sources used by each report.
The information security team must identify all the Power Bl reports and datasets that contain Personally Identifiable Information (Pll).
Fabrikam requires a security solution for the Power Bl tenant. The solution must meet the following requirements:
* Access to the tenant by external users must be approved by a manager and granted by the IT group.
* The external users must be prevented from publishing or modifying content in the tenant
* Users must be prevented from sharing Power Bl reports publicly to the internet.
The new process for deploying Power Bl reports and datasets to the User Experience workspace must ensure that the datasets point to the lake database to which the relevant dataset is deployed. The views in each lake database must present the data in a tabular format.
NEW QUESTION # 67
You have a Power BI report and dataset in Power BI Desktop. The dataset contains a calculation group named CG1 that contains four calculation items. The Current calculation item is shown in the following exhibit.

Answer:
Explanation:
NEW QUESTION # 68
You need to create a measure to count orders for the market basket analysis.
How should you complete the DAX expression? To answer, select the appropriate options in the answer area.
NOTE: Each correct selection is worth one point.
Answer:
Explanation:
NEW QUESTION # 69
You plan to modify a Power Bl dataset.
You open the Impact analysis panel for the dataset and select Notify contacts.
Which contacts will be notified when you use the Notify contacts feature?
- A. the Power Bl admins
- B. any users that accessed a report that uses the dataset within the last 30 days
- C. the workspace admins of any workspace that uses the dataset
- D. all the workspace members of any workspace that uses the dataset
Answer: D
Explanation:
Notify contacts
If you've made a change to a dataset or are thinking about making a change, you might want to contact the relevant users to tell them about it. When you notify contacts, an email is sent to the contact lists of all the impacted workspaces. Your name appears on the email so the contacts can find you and reply back in a new email thread.
NEW QUESTION # 70
You are creating a Python visual in Power Bl Desktop.
You need to retrieve the value of a column named Unit Price from a DataFrame.
How should you reference the Unit Price column in the Python code?
- A. dataset['Unit Price']
- B. data = [Unit Price]
- C. pandas.DataFrame('Unit Price')
- D. ('Unit Price')
Answer: C
Explanation:
Explanation
You can retrieve a column in a pandas DataFrame object by using the DataFrame object name, followed by the label of the column name in brackets.
So if the DataFrame object name is dataframe1 and the column we are trying to retrieve the 'X' column, then we retrieve the column using the statement, dataframe1['X'].
Here's a simple Python script that imports pandas and uses a data frame:
import pandas as pd
data = [['Alex',10],['Bob',12],['Clarke',13]]
df = pd.DataFrame(data,columns=['Name','Age'],dtype=float)
print (df)
When run, this script returns:
Name Age
0 Alex 10.0
1 Bob 12.0
2 Clarke 13.0
Reference:
http://www.learningaboutelectronics.com/Articles/How-to-retrieve-a-column-from-a-pandas-dataframe-object-in
NEW QUESTION # 71
You need to recommend a solution to ensure that sensitivity labels are applied. The solution must minimize administrative effort.
Which three actions should you include in the recommendation? Each correct answer presents part of the solution.
NOTE: Each correct selection is worth one point.
- A. In the Power Bl datasets, apply sensitivity labels to the columns in the Customer and CustomersWithProductScore tables.
- B. From the Power Bl Admin portal, set Make certified content discoverable to Enabled.
- C. From the Power Bl Admin portal, set Allow users to apply sensitivity labels for Power Bl content to Enabled.
- D. In SQLDW. apply sensitivity labels to the columns in the Customer and CustomersWithProductScore tables.
- E. From the Power Bl Admin portal, set Apply sensitivity labels from data sources to their data in Power Bl to Enabled.
Answer: A,B,C
Explanation:
Explanation
A Synapse Analytics dedicated SQL pool is named SQLDW.
Customer contact data in SQLDW and the Power BI dataset must be labeled as Sensitive. Records must be kept of any users that use the sensitive data.
A (not B): Enable sensitivity labels
Sensitivity labels must be enabled on the tenant before they can be used in both the service and in Desktop.
To enable sensitivity labels on the tenant, go to the Power BI Admin portal, open the Tenant settings pane, and find the Information protection section.
In the Information Protection section, perform the following steps:
Open Allow users to apply sensitivity labels for Power BI content.
Enable the toggle.
D (not C): When data protection is enabled on your tenant, sensitivity labels appear in the sensitivity column in the list view of dashboards, reports, datasets, and dataflows.
E: Power BI Tenant Discovery Setting include Make certified content discoverable.
Reference: https://docs.microsoft.com/en-us/power-bi/enterprise/service-security-enable-data-sensitivity-labels
https://docs.microsoft.com/en-us/power-bi/enterprise/service-security-apply-data-sensitivity-labels
https://support.nhs.net/knowledge-base/power-bi-guidance/
NEW QUESTION # 72
After you answer a question in this section, you will NOT be able to return to it. As a result, these questions will not appear in the review screen.
You are using an Azure Synapse Analytics serverless SQL pool to query a collection of Apache Parquet files by using automatic schema inference. The files contain more than 40 million rows of UTF-8-encoded business names, survey names, and participant counts. The database is configured to use the default collation.
The queries use open row set and infer the schema shown in the following table.
You need to recommend changes to the queries to reduce I/O reads and tempdb usage.
Solution: You recommend using openrowset with to explicitly define the collation for businessName and surveyName as Latim_Generai_100_BiN2_UTF8.
Does this meet the goal?
- A. Yes
- B. No
Answer: A
Explanation:
Explanation
Query Parquet files using serverless SQL pool in Azure Synapse Analytics.
Important
Ensure you are using a UTF-8 database collation (for example Latin1_General_100_BIN2_UTF8) because string values in PARQUET files are encoded using UTF-8 encoding. A mismatch between the text encoding in the PARQUET file and the collation may cause unexpected conversion errors. You can easily change the default collation of the current database using the following T-SQL statement: alter database current collate Latin1_General_100_BIN2_UTF8'.
Note: If you use the Latin1_General_100_BIN2_UTF8 collation you will get an additional performance boost compared to the other collations. The Latin1_General_100_BIN2_UTF8 collation is compatible with parquet string sorting rules. The SQL pool is able to eliminate some parts of the parquet files that will not contain data needed in the queries (file/column-segment pruning). If you use other collations, all data from the parquet files will be loaded into Synapse SQL and the filtering is happening within the SQL process. The Latin1_General_100_BIN2_UTF8 collation has additional performance optimization that works only for parquet and CosmosDB. The downside is that you lose fine-grained comparison rules like case insensitivity.
Reference: https://docs.microsoft.com/en-us/azure/synapse-analytics/sql/query-parquet-files
NEW QUESTION # 73
You have a file named File1.txt that has the following characteristics:
* A header row
* Tab delimited values
* UNIX-style line endings
You need to read File1.txt by using an Azure Synapse Analytics serverless SQL pool.
Which query should you execute?
A)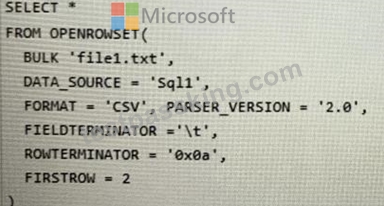
B)
C)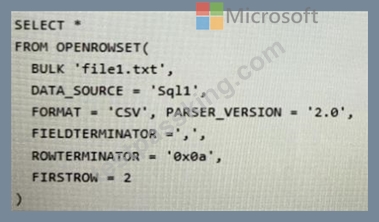
D)
- A. Option B
- B. Option D
- C. Option C
- D. Option A
Answer: D
NEW QUESTION # 74
You need to create the customized Power Bl usage reporting. The Usage Metrics Report dataset has already
been created. The solution must minimize development and administrative effort.
Which four actions should you perform in sequence? To answer, move the appropriate actions from the list of
actions to the answer area and arrange them in the correct order.
Answer:
Explanation:
NEW QUESTION # 75
You have a sales report as shown in the following exhibit.
The sales report has the following characteristics:
The measures are optimized.
The dataset uses import storage mode.
Data points, hierarchies, and fields cannot be removed or filtered from the report page.
From powerbi.com, users experience slow load times when viewing the report.
You need to reduce how long it takes for the report to load without affecting the data displayed in the report.
Which two actions should you perform? Each correct answer presents part of the solution.
NOTE: Each correct selection is worth one point.
- A. Replace the single-value cards with a multi-row card.
- B. Replace all the filters on the Filters pane with visual slicers on the report page.
- C. Change the report theme to monochromatic.
- D. Replace the product category charts with a bar chart for sales and a hierarchy of Category and Sub Category on the axis.
Answer: A,D
NEW QUESTION # 76
You are optimizing a dataflow in a Power Bl Premium capacity. The dataflow performs multiple joins. You need to reduce the load time of the dataflow.
Which two actions should you perform? Each correct answer presents part of the solution. NOTE: Each correct selection is worth one point.
- A. Execute foldable operations before non-foldable operations.
- B. Place the ingestion operations and transformation operations in separate dataflows.
- C. Execute non-foldable operations before foldable operations.
- D. Place the ingestion operations and transformation operations in a single dataflow.
- E. Reduce the memory assigned to the dataflows.
Answer: A,B
Explanation:
Using the compute engine to improve performance
Take the following steps to enable workloads trigger the compute engine, and always improve performance:
For computed and linked entities in the same workspace:
Ensure you perform the operations that fold, such as merges, joins, conversion, and others.
For ingestion focus on getting the data into the storage as fast as possible, using filters only if they reduce the overall dataset size. It's best practice to keep your transformation logic separate from this step, and allow the engine to focus on the initial gathering of ingredients. Next, separate your transformation and business logic into a separate dataflow in the same workspace, using linked or computed entities; doing so allows for the engine to activate and accelerate your computations. In our analogy, it's like food preparation in the kitchen: food preparation is typically a separate and distinct step from gathering your raw ingredients, and a pre-requisite for putting the food in the oven. Similarly, your logic needs to be prepared separately before it can take advantage of the compute engine.
NEW QUESTION # 77
You are building a Power Bl dataset that contains a table named Calendar. Calendar contains the following
calculated column.
pfflag = IF('Calendar'[Date] < TOOAYQ, "Past", "Future")
You need to create a measure that will perform a fiscal prior year-to-date calculation that meets the following
requirements:
* Returns the fiscal prior year-to-date value for [sales Amount]
* Uses a fiscal year end of June 30
* Produces no result for dates in the future
How should you complete the DAX expression? To answer, select the appropriate options in the answer area.
NOTE: Each correct selection is worth one point.
Answer:
Explanation:
NEW QUESTION # 78
You have a Power Bl dataset. The dataset contains data that is updated frequently.
You need to improve the performance of the dataset by using incremental refreshes.
Which four actions should you perform in sequence to enable the incremental refreshes? To answer, move the appropriate actions from the list of actions to the answer area and arrange them in the correct order.
Answer:
Explanation:
1 - Create RangeStart and RangeEnd parameters.
2 - Apply a custom Date/Time filter to the data.
3 - Define the incremental refresh policy for the table.
4 - Publish the model to the Power BI service.
NEW QUESTION # 79
You are creating a Power Bl Desktop report.
You add a Python visual to the report page.
You plan to create a scatter chart to visualize the data.
You add Python code to the Python script editor.
You need to create the scatter chart.
How should you complete the Python code? To answer, select the appropriate options in the answer area.
NOTE: Each correct selection is worth one point.
Answer:
Explanation:
NEW QUESTION # 80
You are using a Python notebook in an Apache Spark pool in Azure Synapse Analytics.
You need to present the data distribution statistics from a DataFrame in a tabular view.
Which method should you invoke on the DataFrame?
- A. describe
- B. freqltems
- C. explain
- D. sample
Answer: A
Explanation:
Explanation
pandas.DataFrame.describe
Descriptive statistics include those that summarize the central tendency, dispersion and shape of a dataset's distribution, excluding NaN values.
Analyzes both numeric and object series, as well as DataFrame column sets of mixed data types. The output will vary depending on what is provided.
Reference: https://pandas.pydata.org/pandas-docs/stable/reference/api/pandas.DataFrame.describe.html
NEW QUESTION # 81
You have an Azure Synapse Analytics serverless SQL pool.
You need to catalog the serverless SQL pool by using Azure Purview.
Which three actions should you perform? Each correct answer presents part of the solution.
NOTE: Each correct selection is worth one point.
- A. Create a managed identity in Azure Active Directory (Azure AD).
- B. Assign the Storage Blob Data Reader role to the Azure Purview managed service identity (MSI) for the storage account associated to the Synapse Analytics workspace.
- C. Register a data source.
- D. Assign the Owner role to the Azure Purview managed service identity (MSI) for the Azure Purview resource group.
- E. Assign the Reader role to the Azure Purview managed service identity (MSI) for the Synapse Analytics workspace.
Answer: A,B,E
Explanation:
Authentication for enumerating serverless SQL database resources
There are three places you'll need to set authentication to allow Microsoft Purview to enumerate your serverless SQL database resources:
The Azure Synapse workspace
The associated storage
The Azure Synapse serverless databases
The steps below will set permissions for all three.
Azure Synapse workspace
In the Azure portal, go to the Azure Synapse workspace resource.
On the left pane, selectAccess Control (IAM).
Select the Add button.
Set the Reader role and enter your Microsoft Purview account name, which represents its managed service identity (MSI).
Select Save to finish assigning the role
Azure Synapse Analytics serverless SQL pool catalog Purview Azure Purview managed service identity Storage account In the Azure portal, go to the Resource group or Subscription that the storage account associated with the Azure Synapse workspace is in.
On the left pane, selectAccess Control (IAM).
Select the Add button.
Set the Storage blob data reader role and enter your Microsoft Purview account name (which represents its MSI) in the Select box.
Select Save to finish assigning the role.
Azure Synapse serverless database
Go to your Azure Synapse workspace and open the Synapse Studio.
Select the Data tab on the left menu.
Select the ellipsis (...) next to one of your databases, and then start a new SQL script.
Add the Microsoft Purview account MSI (represented by the account name) on the serverless SQL databases. You do so by running the following command in your SQL script:
SQL
CREATE LOGIN [PurviewAccountName] FROM EXTERNAL PROVIDER;
Apply permissions to scan the contents of the workspace
You can set up authentication for an Azure Synapse source in either of two ways. Select your scenario below for steps to apply permissions.
Use a managed identity
Use a service principal
NEW QUESTION # 82
You open a Power Bl Desktop report that contains an imported data model and a single report page.
You open Performance analyzer, start recording, and refresh the visuals on the page. The recording produces the results shown in the following exhibit
What can you identify from the results?
- A. When all the visuals refresh simultaneously, the visuals spend most of the time waiting on other processes to finish.
- B. The Actual/Forecast Hours by Type visual takes a long time to render on the report page when the data is cross-filtered.
- C. The Actual/Forecast Billable Hrs YTD visual displays the most data.
- D. Unoptimized DAX queries cause the page to load slowly.
Answer: A
Explanation:
Most time is spent in the category Other - time required by the visual for preparing queries, waiting for other visuals to complete, or performing other background processing.
Note: Each visual's log information includes the time spent (duration) to complete the following categories of tasks:
DAX query - if a DAX query was required, this is the time between the visual sending the query, and for Analysis Services to return the results.
Visual display - time required for the visual to draw on the screen, including time required to retrieve any web images or geocoding.
Other - time required by the visual for preparing queries, waiting for other visuals to complete, or performing other background processing.
NEW QUESTION # 83
You have an Azure Synapse Analytics notebook.
You run the xxsq1 magic command to render data into an Apache Spark DataFrame named df1, and then you run the following code.
display (df1, summary = true)
Which three attributes will be returned by the command? Each correct answer presents part of the solution. NOTE: Each correct selection is worth one point.
- A. unique
- B. type
- C. range
- D. missing
- E. ordinal
Answer: B,C,D
NEW QUESTION # 84
......
The Most In-Demand DP-500 Pass Guaranteed Quiz : https://www.testpassking.com/DP-500-exam-testking-pass.html
View All DP-500 Actual Exam Questions Answers and Explanations for Free: https://drive.google.com/open?id=1JMPEoFniAYsWMTypO3KfMZXHJ-B6fnn6